Prometheus Metrics
To help with operations and insights into cert-manager activities, cert-manager exposes metrics in the Prometheus format from the controller, webhook and cainjector components. These are available at the standard /metrics endpoint on port 9402 of each component Pod.
Application-specific cert-manager metrics (Certificates, Issuers, ACME, Venafi, and controller sync) are exported by the controller. The webhook and cainjector expose the same /metrics endpoint (including Go runtime and process metrics) so they can be scraped with the same PodMonitor.
⚠️ Metric cardinality and first use: Prometheus client libraries typically create labeled time series only when a metric is first observed. Immediately after startup you may see an empty or sparse
/metricsresponse until controllers have reconciled resources or made outbound requests. Scraping works; there may simply be no application series yet. Issuing a test Certificate (or waiting for existing resources to reconcile) usually populates the Certificate/Issuer gauges. See cert-manager#3446.
Scraping Metrics
How metrics are scraped will depend how you're operating your Prometheus server(s). These examples presume the Prometheus Operator is being used to run Prometheus, and configure Pod or Service Monitor CRDs.
Helm
If you're deploying cert-manager with helm, a PodMonitor resource can be configured. This configuration should enable metric scraping, and the configuration can be further tweaked as described in the Helm configuration documentation.
prometheus:enabled: truepodmonitor:enabled: true
Regular Manifests
If you're not using helm to deploy cert-manager and instead using the provided regular YAML manifests, this example PodMonitor should be all you need to start ingesting cert-manager metrics.
apiVersion: monitoring.coreos.com/v1kind: PodMonitormetadata:name: cert-managernamespace: cert-managerlabels:app: cert-managerapp.kubernetes.io/name: cert-managerapp.kubernetes.io/instance: cert-managerspec:jobLabel: app.kubernetes.io/nameselector:matchExpressions:- key: app.kubernetes.io/nameoperator: Invalues:- cainjector- cert-manager- webhook- key: app.kubernetes.io/instanceoperator: Invalues:- cert-manager- key: app.kubernetes.io/componentoperator: Invalues:- cainjector- controller- webhookpodMetricsEndpoints:- port: http-metrics
TLS
TLS can be enabled on the metrics endpoint for end-to-end encryption. This is achieved either using pre-signed static certificates, or using the internal dynamic certificate signing.
Static certificates
Static certificates can be provided to the cert-manager to use when listening on the metric endpoint. If the certificate files are changed then cert-manager will reload the certificates for zero-downtime rotation.
Static certificates can be specified via the flags --metrics-tls-cert-file and --metrics-tls-private-key-file or the corresponding config file parameters metricsTLSConfig.filesystem.certFile and metricsTLSConfig.filesystem.keyFile.
The certificate and private key must be mounted into the controller pod for this to work, if cert-manager is deployed using helm the .volumes[] and .mounts[] properties can facilitate this.
An example Helm values file would be:
# values.yamlprometheus:enabled: trueconfig:metricsTLSConfig:filesystem:certFile: "/path/to/cert.pem"keyFile: "/path/to/key.pem"webhook:config:metricsTLSConfig:filesystem:certFile: "/path/to/cert.pem"keyFile: "/path/to/key.pem"cainjector:config:metricsTLSConfig:filesystem:certFile: "/path/to/cert.pem"keyFile: "/path/to/key.pem"
Dynamic certificates
In this mode cert-manager will create a CA in a named Secret, then use this CA to sign the metrics endpoint certificates. This mode will also take care of rotation, auto rotating the certificate as required.
Dynamic certificates can be specified via the flags --metrics-dynamic-serving-ca-secret-namespace, --metrics-dynamic-serving-ca-secret-name and --metrics-dynamic-serving-dns-names or the corresponding config file parameters metricsTLSConfig.dynamic.secretNamespace, metricsTLSConfig.dynamic.secretName and metricsTLSConfig.dynamic.dnsNames.
An example Helm values file would be:
# values.yamlprometheus:enabled: truepodmonitor:enabled: trueendpointAdditionalProperties:scheme: httpstlsConfig:serverName: cert-manager-metricsca:secret:name: cert-manager-metrics-cakey: "tls.crt"config:metricsTLSConfig:dynamic:secretNamespace: "cert-manager"secretName: "cert-manager-metrics-ca"dnsNames:- cert-manager-metricswebhook:config:metricsTLSConfig:dynamic:secretNamespace: "cert-manager"secretName: "cert-manager-metrics-ca"dnsNames:- cert-manager-metricscainjector:config:metricsTLSConfig:dynamic:secretNamespace: "cert-manager"secretName: "cert-manager-metrics-ca"dnsNames:- cert-manager-metrics
ℹ️ This configuration will result in a single new Secret
cert-manager/cert-manager-metrics-cacontaining a CA. The firstcontroller,webook, orcainjectorPod will create the CA Secret and the others will then use it.All the controller, webhook, and cainjector Pods will generate their own unique metrics serving certificates and sign them with the CA private key.
The
PodMonitoris configured to read the public certificate from the CA Secret and Prometheus will use that CA when it connects to the metrics servers of each of the matching Pods.All the serving certificates share the same DNS name. That same name must be added to the
PodMonitorand Prometheus will use that hostname when it connects to the metrics servers of each of the matching Pods.
Troubleshooting
Check the controller, webhook and cainjector logs to see the CA certificate and serving certificates being created and updated:
kubectl -n cert-manager logs -l app.kubernetes.io/instance=cert-manager --prefix
I0719 15:21:28.113411 1 dynamic_source.go:172] "Detected root CA rotation - regenerating serving certificates" logger="cert-manager"I0719 15:21:28.115018 1 dynamic_source.go:290] "Updated cert-manager TLS certificate" logger="cert-manager" DNSNames=["cert-manager-metrics"]
Check the connection to the metrics endpoint using kubectl port-forward and curl:
kubectl port-forward -n cert-manager deployment/cert-manager-webhook 9402curl --insecure -v https://localhost:9402/metrics
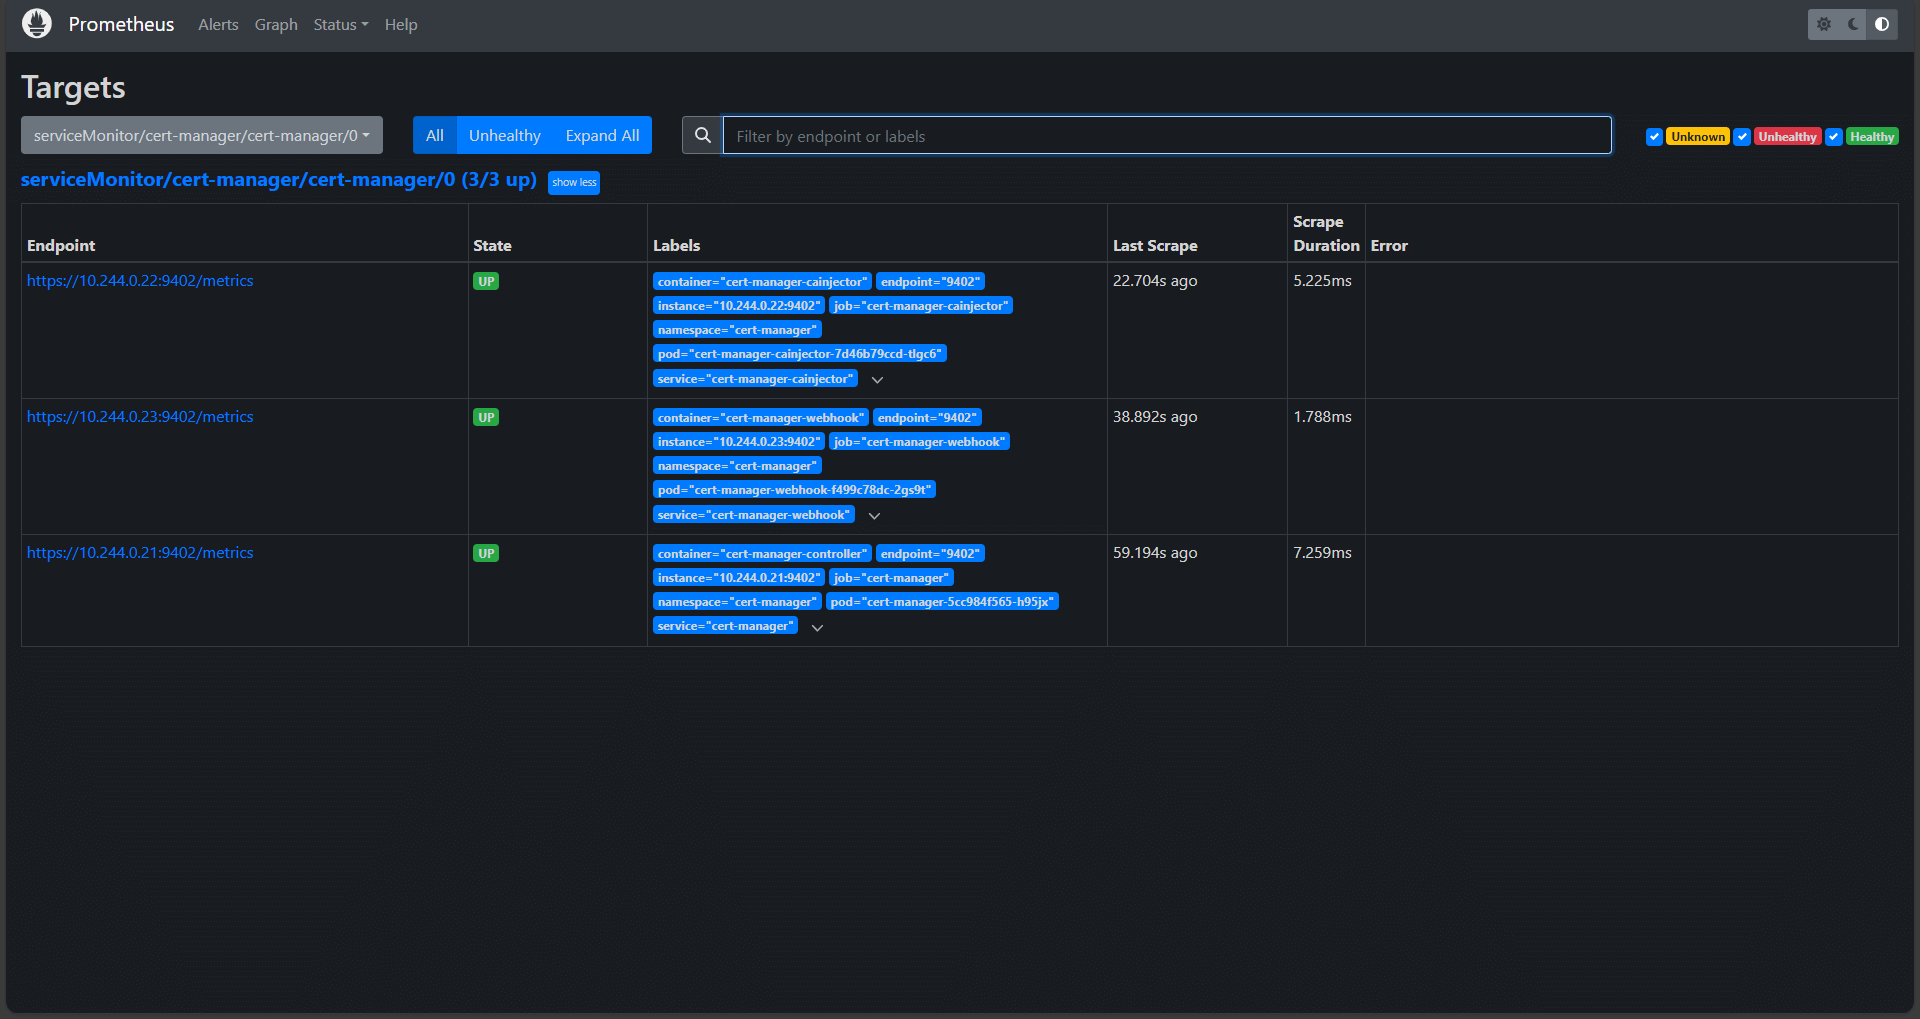
Check the health of the cert-manager scrape targets on the Prometheus status page:
Available metrics
The tables below list the Prometheus metrics exported by the cert-manager controller. Metric names use the certmanager_ namespace (some ACME/Venafi HTTP client metrics also include an http_ subsystem).
The source of truth for these metrics is pkg/metrics and internal/collectors in the cert-manager repository. If you add or change a metric in code, update this page in the same change set (or follow up immediately).
In addition to the application metrics below, each component registers the Prometheus Go collector and process collector (go_* and process_* series).
Certificate metrics
These gauges are derived from Certificate resources known to the controller. Ready-status metrics emit one series per condition value (True, False, Unknown), with value 1 for the current condition and 0 otherwise.
| Metric | Type | Labels | Description |
|---|---|---|---|
certmanager_certificate_ready_status | Gauge | name, namespace, condition, issuer_name, issuer_kind, issuer_group | Ready condition of the Certificate (True / False / Unknown). |
certmanager_certificate_expiration_timestamp_seconds | Gauge | name, namespace, issuer_name, issuer_kind, issuer_group | Unix timestamp when the Certificate expires (status.notAfter). Kept for compatibility; prefer certmanager_certificate_not_after_timestamp_seconds. |
certmanager_certificate_not_after_timestamp_seconds | Gauge | name, namespace, issuer_name, issuer_kind, issuer_group | Unix timestamp after which the Certificate is invalid (status.notAfter). |
certmanager_certificate_not_before_timestamp_seconds | Gauge | name, namespace, issuer_name, issuer_kind, issuer_group | Unix timestamp before which the Certificate is invalid (status.notBefore). |
certmanager_certificate_renewal_timestamp_seconds | Gauge | name, namespace, issuer_name, issuer_kind, issuer_group | Unix timestamp after which cert-manager should renew the Certificate (status.renewalTime). |
ACME Challenge metrics
| Metric | Type | Labels | Description |
|---|---|---|---|
certmanager_certificate_challenge_status | Gauge | status, domain, reason, processing, name, namespace, type | Current ACME Challenge state. One series is emitted per known status value; the active status has value 1. type is the challenge type (for example HTTP-01 or DNS-01). |
Issuer metrics
| Metric | Type | Labels | Description |
|---|---|---|---|
certmanager_issuer_ready_status | Gauge | name, namespace, condition | Ready condition of a namespaced Issuer (True / False / Unknown). |
certmanager_clusterissuer_ready_status | Gauge | name, condition | Ready condition of a ClusterIssuer (True / False / Unknown). |
ACME client metrics
Emitted for outbound HTTP requests made by cert-manager's ACME client.
| Metric | Type | Labels | Description |
|---|---|---|---|
certmanager_http_acme_client_request_count | Counter | scheme, host, action, method, status | Total number of outbound ACME HTTP requests. |
certmanager_http_acme_client_request_duration_seconds | Summary | scheme, host, action, method, status | Latency of outbound ACME HTTP requests in seconds (summary quantiles). |
Venafi metrics
Venafi client latency and OAuth token request metrics. OAuth token metrics are emitted whenever a Venafi Issuer or ClusterIssuer authenticates against a TPP, Cloud, or Next-Gen Trust Security (NGTS) endpoint.
| Metric | Type | Labels | Description |
|---|---|---|---|
certmanager_http_venafi_client_request_duration_seconds | Summary | api_call | Alpha. Latency of Venafi API calls in seconds, labeled by logical API call type (for example request_certificate). |
certmanager_venafi_oauth_token_requests_total | Counter | status (success | failure) | Total number of Venafi OAuth token requests made by cert-manager. |
certmanager_venafi_oauth_token_request_duration_seconds | Histogram | — | Duration of Venafi OAuth token requests. Buckets cover typical token-exchange latencies from 10ms to 30s. |
These OAuth metrics can be used to alert on elevated token request failure rates or unexpected latency increases in the authentication flow.
Controller sync metrics
| Metric | Type | Labels | Description |
|---|---|---|---|
certmanager_controller_sync_call_count | Counter | controller | Number of sync() calls made by a controller. |
certmanager_controller_sync_error_count | Counter | controller | Number of errors encountered during controller sync(). Use with controller_sync_call_count to derive error rates. |
Clock metrics
| Metric | Type | Labels | Description |
|---|---|---|---|
certmanager_clock_time_seconds_gauge | Gauge | — | Current clock time as Unix seconds. Prefer this over the deprecated counter below. |
certmanager_clock_time_seconds | Counter | — | Deprecated. Same clock reading as a counter type; use certmanager_clock_time_seconds_gauge instead. |
Monitoring Mixin
Monitoring mixins are a way to bundle common alerts, rules, and dashboards for an application in a configurable and extensible way, using the Jsonnet data templating language. A cert-manager monitoring mixin can be found here https://github.com/imusmanmalik/cert-manager-mixin. Documentation on usage can be found with the cert-manager-mixin project.